Tutorial on the use of Excel
for computations with the normal distributions
1. Initial overview
Excel has a series of functions to make computations with the normal
distribution, and in case we have Excel we do not need to use a table
for the standard normal distribution.
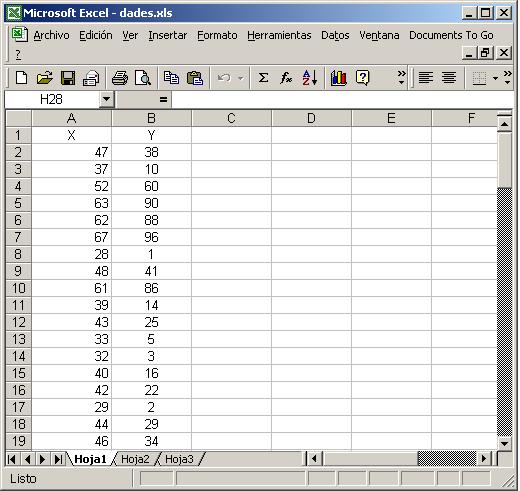
In this tutorial we will work with two variables, X and Y. The
first one is closer to the normal distribution than the second one.
You can find the data here:
Data for the variables X and Y
You will see that at this data set there are two variables, X and Y:
To check for normality of the distribution of a variable we have
different tools.
We can first check the symmetry or skewness and the kurtosis. This
will allow us to see if the distribution has a form that is similar to
the normal distribution or not.
The second thing we can check is percentages of frequencies that we
can find at intervals defined around the mean of our distribution with
respect to exact multiples of the standard deviation, to see if they
are similar to the ones of the normal distribution. We will do this
with R in another tutorial.
We will see now what tools we have at Excel.