All ODStatistics data analysis worksheets work more or less in the
same way. For instance to perform the data analysis of one categorical
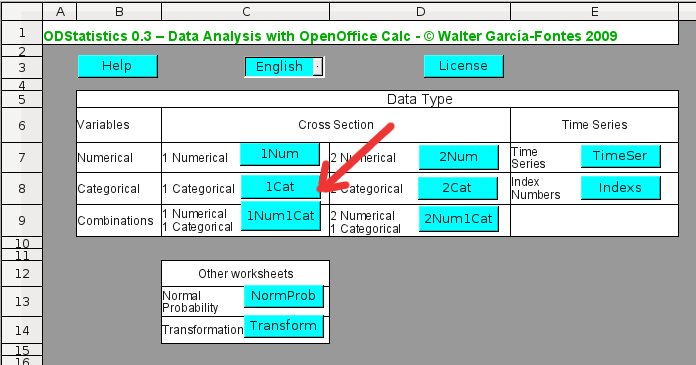
variable, the initial menu (spreadsheet "odstats.ods") has to be
opened and the "1CAT" option has to be chosen:
If you click over this option, the worksheet to analyze one
categorical variable will be opened:
The organization of this spreadsheet is the same as "1NUM", the
first worksheet is called "Help" (containing general information
abouo this spreadsheet), then we find "Data Entry" (to enter the
data) and "Summaries" (for numerical and graphical summaries):
Click at the bottom over "Data Entry" to go to the worksheet where
the data has to be entered. Here we find some initial data (not our
data) and we can see the following screen:
We will now open a spreadsheet where we have categorical data. The
data comes of a survey performed with 15 individuals about their
preferred alcoholic beverages type. To open the spreadsheet click over
its name, taste.ods:
To paste the data we will proceed as before. We choose the data that
we want to paste highlighting them with the mouse. We copy them into
the OpenOffice Calc clipboard with the "Edit" menu and the "Copy"
option (if you do not remember how it is done, go back to
to the explanation on how to do it for a
numerical variable. You have to just copy the data from the second
column, including the first row with the name of the variable. The
first column, "Survey", only containes an indicator of each
individual that has been surveyed.
We now return to the 2Cat spreadsheet and double-clci over the A1 cell
where it says
Data, and you should get the following dialog:
We now click over "OK" and our data is going to be pasted in the
"1CAT" spreadsheet. The analysis will be updated and we are able to
start interpreting them:
The same data entry procedure is used in all ODStatistics analysis
worksheets, "pasting" them in the area under Data
at the "Data Entry" worksheet using the dialog that we get.